


TPP11, 53.4% of companies saying “necessary for Japan”
- Teikoku
- Jan 25, 2019
- 3 min read

~ ”Restaurants” ranked top for a positive impact on their own company, “agriculture, forestry and fisheries” was top for a negative impact ~
TPP11 (Comprehensive and Progressive Agreement for Trans-Pacific Partnership: CPTPP) entered into force on December 30, 2018. Comprehensive trade rules in TPP11 are expected to impact not only other trade negotiations the government proceeds, but also companies which do not conduct overseas transactions, so attention has been paid to the development of TPP11. On the other hand, the U.S., which withdrew from TPP, is requesting bilateral trade negotiations, so negotiations for a U.S.-Japan Trade Agreement on Goods (TAG) will start in January 2019. Teikoku Databank has conducted a survey of corporate attitudes towards TPP11. This survey was conducted in conjunction with the December 2018 TDB Trends Research, and it is the 4th such survey on TPP and TPP11 following those of December 2010, December 2015, and June 2017. *Survey period: December 14, 2018 – January 7, 2019; Companies Surveyed: 23,059; Valid Responses: 9,619 (Response Rate: 41.7%) *Details of this survey can be found on the dedicated Economic Trend Survey HP. (http://www.tdb-di.com)
Survey results (Summary)
1. 53.4% of companies responded that TPP11 is “necessary for Japan,” which is muchhigher by 43.7 points than those that responded that TPP is “not necessary” (9.7%). 24.9% of them think it is “necessary” in the industry to which these companies belong, but companies’ opinions are split in two. Compared to the previous survey (in June 2017) after the ministerial meeting of the 11 countries, companies affirming the need have moderately increased.
2. With respect to the impact on their own company, those saying “positive impact” (12.1%) exceeded those saying "negative impact" (4.7%). Those saying “no impact” or "do not know" accounted for 37.6% and 45.5%, respectively. By industry, “restaurants” ranked top (32.6%) for a positive impact, and "agriculture, forestry and fisheries" was top (46.3%) for a negative impact.
3. Among companies that assume specific details and impacts, "cost reduction of raw materials" ranked top (39.0%) for positive aspects, followed by “increase in sales and profits” (34.1%), and "export increase" (33.6%) in the range over 30%. "Selling price decline" ranked top (27.7%) for negative aspects, followed by “intensified competition due to increasing new entrants” (24.4%) and “decrease in sale and profits” (16.4%).
4. With respect to anticipated trade negotiations, "Regional Comprehensive Economic Partnership (RCEP)" ranked top at 32.8%, followed by "Free Trade Area of the Asia-Pacific (FTAAP)" (29.6%), and "Japan-China-Republic of Korea Free Trade Agreement (FTA)” (16.7%). “US-Japan Trade Agreement on Goods (TAG)” stood at 14.3%.
Appendix
1.Research Subjects(Companies Researched 23,059 ; Valid responses: 9,619 ; Response rate: 41.7%)


2.Research Items
*Business Confidence (current, in 3 months, in 6 months, in 1 year)
*Business Conditions (sales, purchasing and selling unit price, inventory, capacity utilization ratio, number of employees, overtime work hours)
3.Research Period and Methodology
Internet-based survey conducted December 14 2018 – January 7 2019
The explanation of the Economic Diffusion Index
Research Purpose/Researched Terms
TDB Economic Trend Research (started from May 2002) is a monthly statistical survey conducted for over 20,000 nationwide corporations on their general business activities including the current condition and future outlook of the industry business performance and operating climate. The primary purpose of such a survey is to assess the current state of Japan’s economy.
Selection of the Subject Corporations
Companies of all sizes in all domestic industries are eligible to participate in the survey.
DI Calculation
The DI(Diffusion Index) is calculated by multiplying the number of responses for each assessment category by the number given in parentheses in the table below, to a seven-level assessment rated by companies.

[if gte vml 1]><v:shapetype id="_x0000_t75" coordsize="21600,21600" o:spt="75" o:preferrelative="t" path="m@4@5l@4@11@9@11@9@5xe" filled="f" stroked="f"> <v:stroke joinstyle="miter"></v:stroke> <v:formulas> <v:f eqn="if lineDrawn pixelLineWidth 0"></v:f> <v:f eqn="sum @0 1 0"></v:f> <v:f eqn="sum 0 0 @1"></v:f> <v:f eqn="prod @2 1 2"></v:f> <v:f eqn="prod @3 21600 pixelWidth"></v:f> <v:f eqn="prod @3 21600 pixelHeight"></v:f> <v:f eqn="sum @0 0 1"></v:f> <v:f eqn="prod @6 1 2"></v:f> <v:f eqn="prod @7 21600 pixelWidth"></v:f> <v:f eqn="sum @8 21600 0"></v:f> <v:f eqn="prod @7 21600 pixelHeight"></v:f> <v:f eqn="sum @10 21600 0"></v:f> </v:formulas> <v:path o:extrusionok="f" gradientshapeok="t" o:connecttype="rect"></v:path> <o:lock v:ext="edit" aspectratio="t"></o:lock> </v:shapetype><v:shape id="_x0000_s1027" type="#_x0000_t75" style='position:absolute; margin-left:18pt;margin-top:430.5pt;width:375.45pt;height:80.25pt;z-index:251658240; mso-position-horizontal-relative:text;mso-position-vertical-relative:text'> <v:imagedata src="file:///C:\Users\GUESTU~1\AppData\Local\Temp\msohtmlclip1\01\clip_image001.wmz" o:title=""></v:imagedata> </v:shape><![if gte mso 9]><o:OLEObject Type="Embed" ProgID="Equation.3" ShapeID="_x0000_s1027" DrawAspect="Content" ObjectID="_1609937069"> </o:OLEObject> <![endif]><![endif][if !vml][endif]

An economic DI of 50 is the point separating good and bad, so a DI over 50 means “good,” and below 50 means “bad.” (The numbers are rounded off to one decimal place.) No weight is given according to a company's size, and calculations are made on the basis of “one company, one vote.”
Size Classification
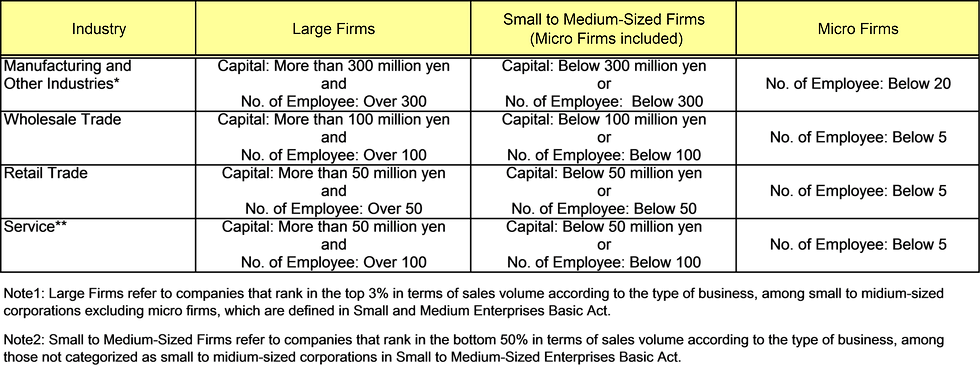


Commenti